
Daylighting Research and Standards
Over the years, we have been actively engaged in a variety of daylighting-related research and standard development efforts. We provide research services related to developing daylighting performance metrics, simulation, and design methods and techniques, photosensor and control modeling, material measurement and modeling, and optical daylighting product evaluation techniques. We have also been involved in developing a number of daylighting metrics and standards for use in codes, building rating systems, and design guidelines.
-

Annual Sky Modeling
We’ve developed innovative ways to analyze annual, climate-based skies and effectively use them to analyze and guide the design.
-
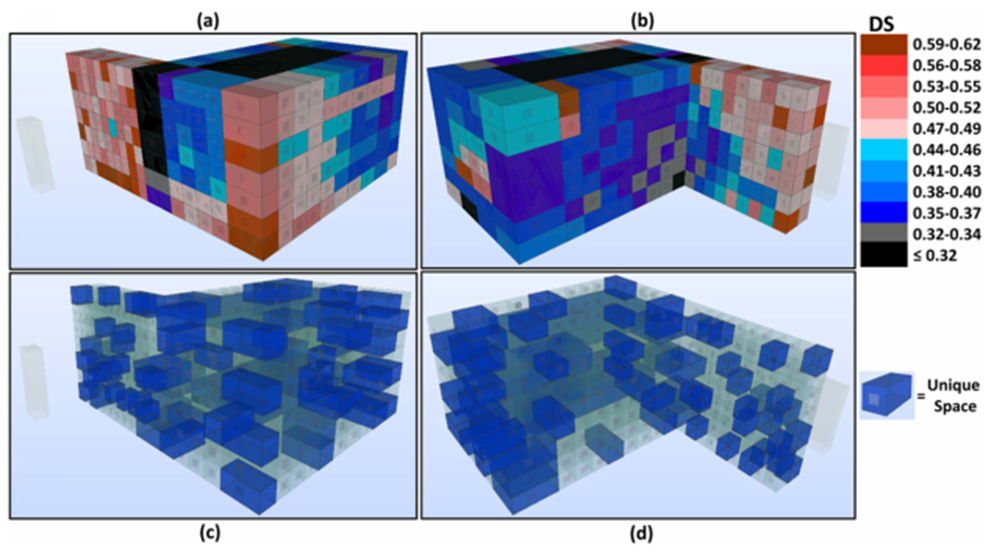
Whole Building Daylight Profiler
Whole building simulation requires innovative techniques to ensure accuracy and to give tangible feedback to improve the design.
-
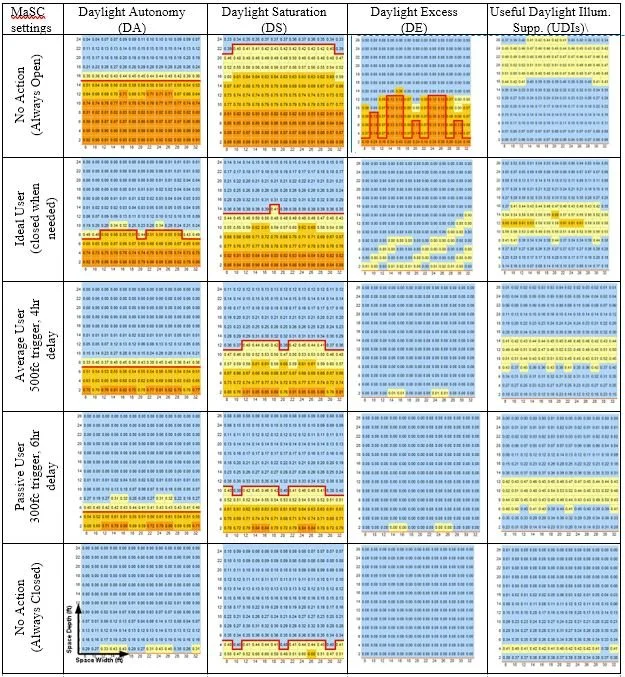
Shade Control Algorithms
Window treatments can make a big difference in daylighting performance, so innovative shade control algorithms help ensure fair comparisons and accurate design guidance.
-

Daylighting Metrics
Innovative daylight metrics help guide a design to ensure optimal indoor environmental quality and energy efficiency.
-
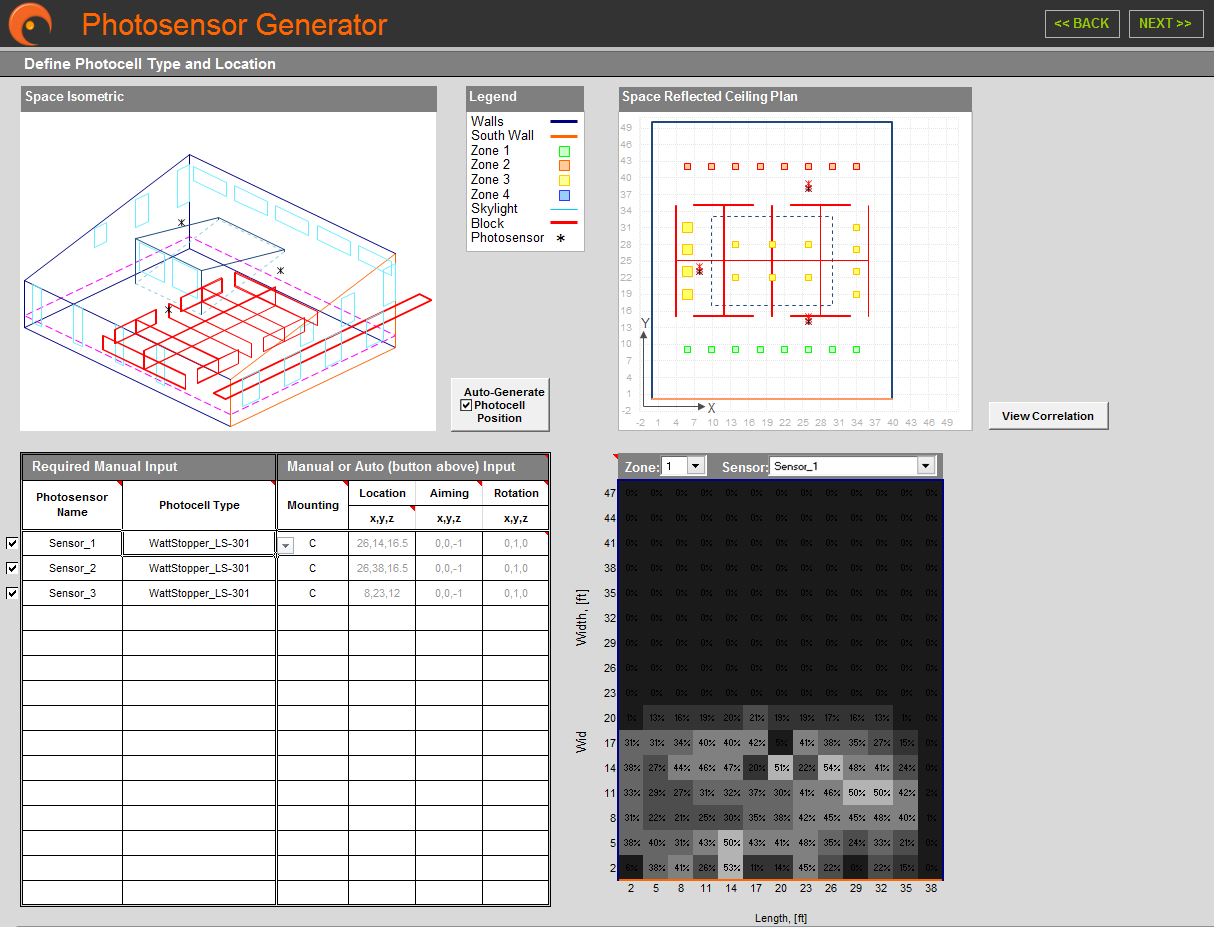
Photosensor Placement Optimization Algorithms
Built into the SPOT software, we’ve developed tools to analyze the lumuinous environment of a space under both daylight and electric lighting and optimize the location of photosensor controls.
-

Optical Daylighting Device Validation and Simulation Methods
Using measured skies, we can validate daylighting device performance and create models for use in simulation and analysis.
-
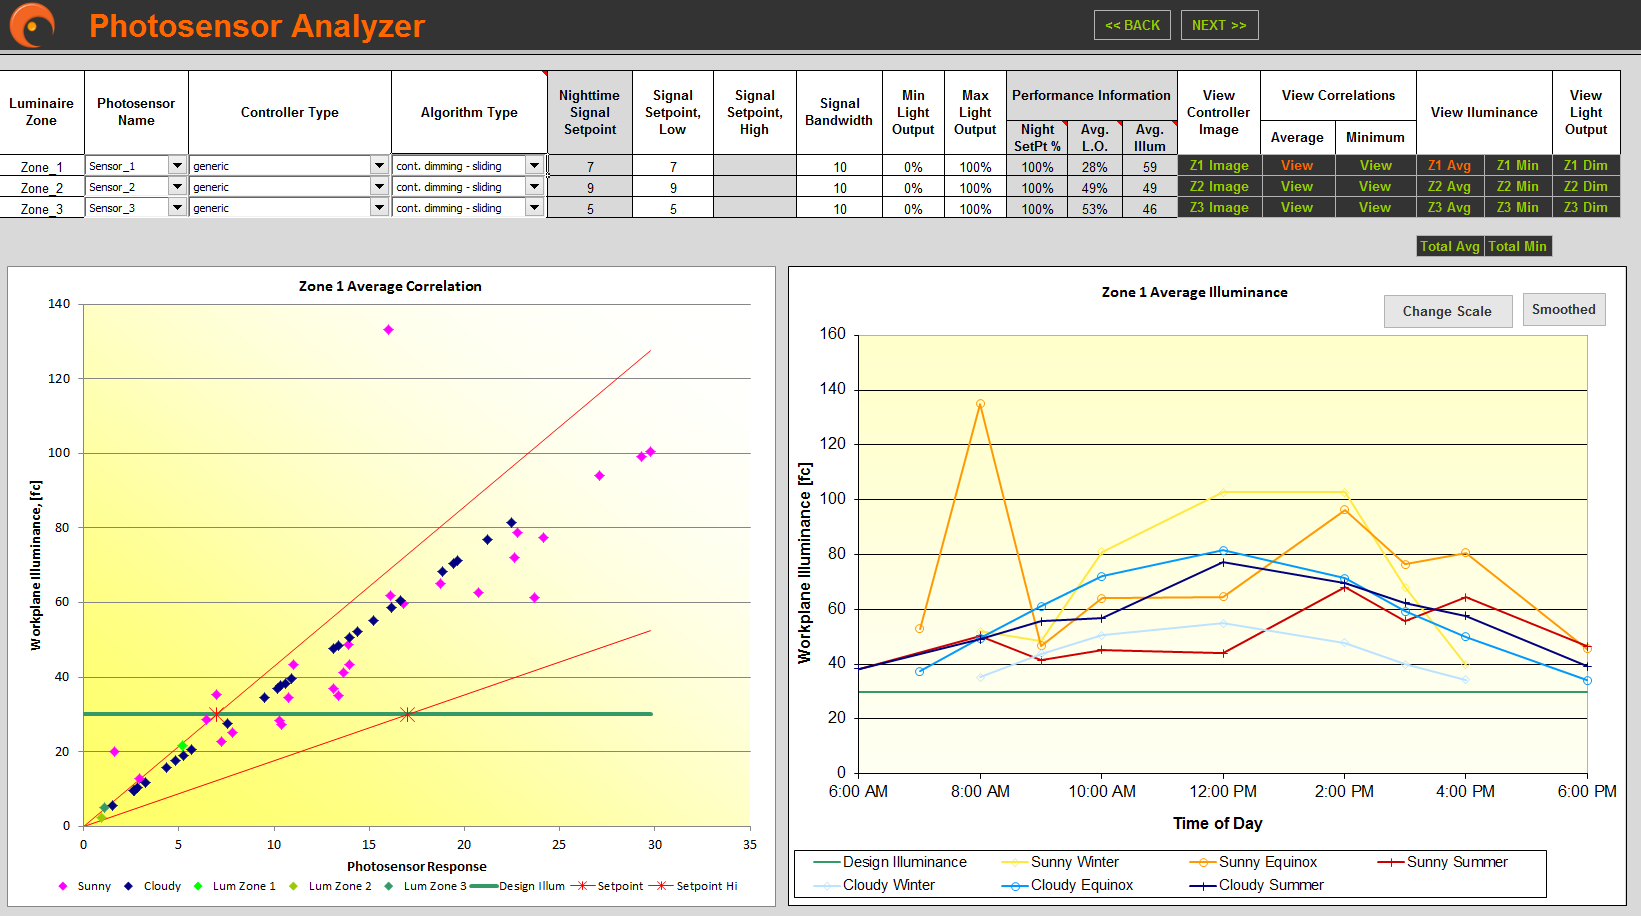
Closed-loop Photosensor Control Algorithms
Integrated into the SPOT photosensor analysis tools, algorithms determine the interaction between various closed-loop control zones and help optimize settings to avoid ‘flicker’ issues and optimize savings.